I designed a custom CRM for a transportation logistics company that has specialized in car shipping across the U.S. since 2007. Frustrated by limited CRM options used by competitors, the company needed a scalable, fully integrated solution to manage their entire operation—from marketing to shipment execution. My tailored CRM addresses these challenges, streamlining processes and enhancing their competitive edge.
User Research and Persona Development: Conduct user research to understand the needs, preferences, and pain points of logistics companies, carriers, and customers. Develop detailed user personas, such as dispatchers, brokers, carriers, and customers, to guide design decisions and feature prioritization, ensuring the CRM aligns with the needs of all key stakeholders.
Usability Testing and Feedback Loop: Implement usability testing to evaluate the CRM's current interface and functionality. Gather feedback from staff, carriers, and customers through surveys, interviews, and user testing sessions. Use this feedback to iterate on the UI and streamline operations, such as scheduling shipments or quoting services.
Streamlined Navigation and Information Architecture: Simplify navigation to allow users to easily manage bookings, quotes, and carrier assignments. Organize the information architecture around core CRM functions like order management, carrier communication, invoicing, and tracking. Use clear labeling and logical flow to enhance operational efficiency.
Personalization and Customization Options: Incorporate personalized features such as dashboards tailored to the roles of different users (dispatchers, managers, carriers), saved preferences, and recommended actions based on past activity (e.g., preferred carriers or shipment routes). Allow users to customize reports, notifications, and shipment views to meet their specific operational needs.
The Design
1
Load Board
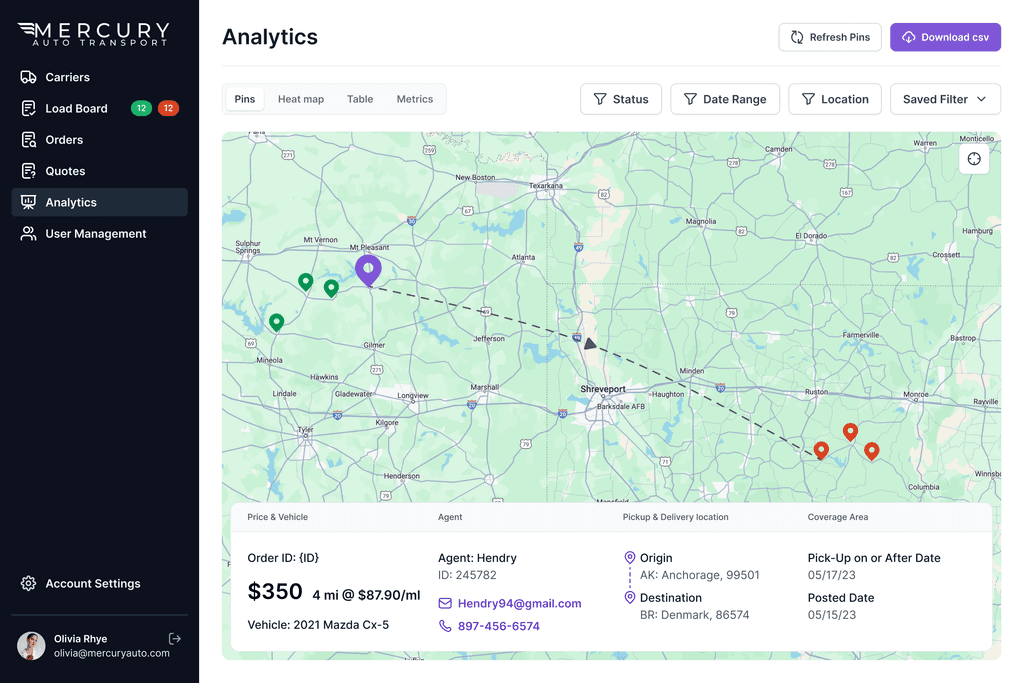
Price & Vehicle: This section contains the price of the transportation and model of the vehicle that needs to be transported.
Agent: This section will contain the agent name, ID, Mail and Phone number. In which the mail and phone number is a hyperlink.
Pickup & Delivery Location: This section contains Pick up location and drop location of the shipment, The "View Route" link will open the map window which shows where the transportation starts and ends
Coverage Area: This section will show pickup date and posted date.
Comments: The agent can add specific comments in the section.
2
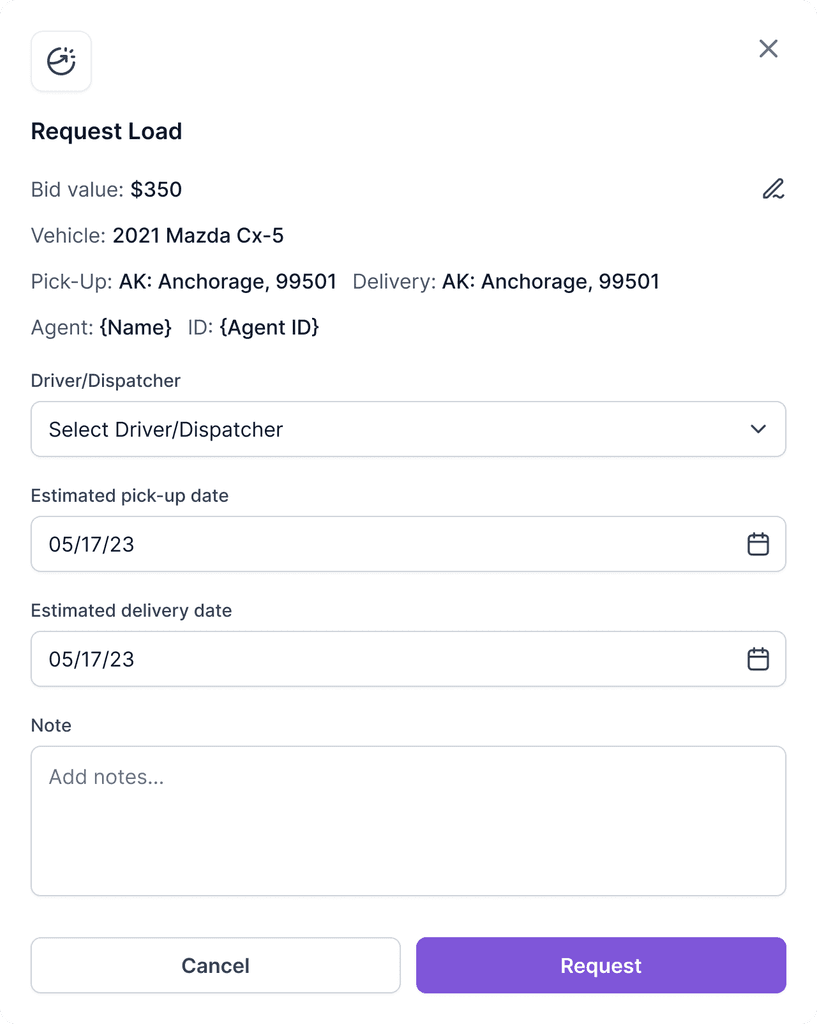
Request Load
This dialog box serves to set a pick-up and drop-off date and to submit a load request. The requisitioned load then shows up on the load board for the administrator to review and endorse, contingent on the data supplied by the carrier.
3
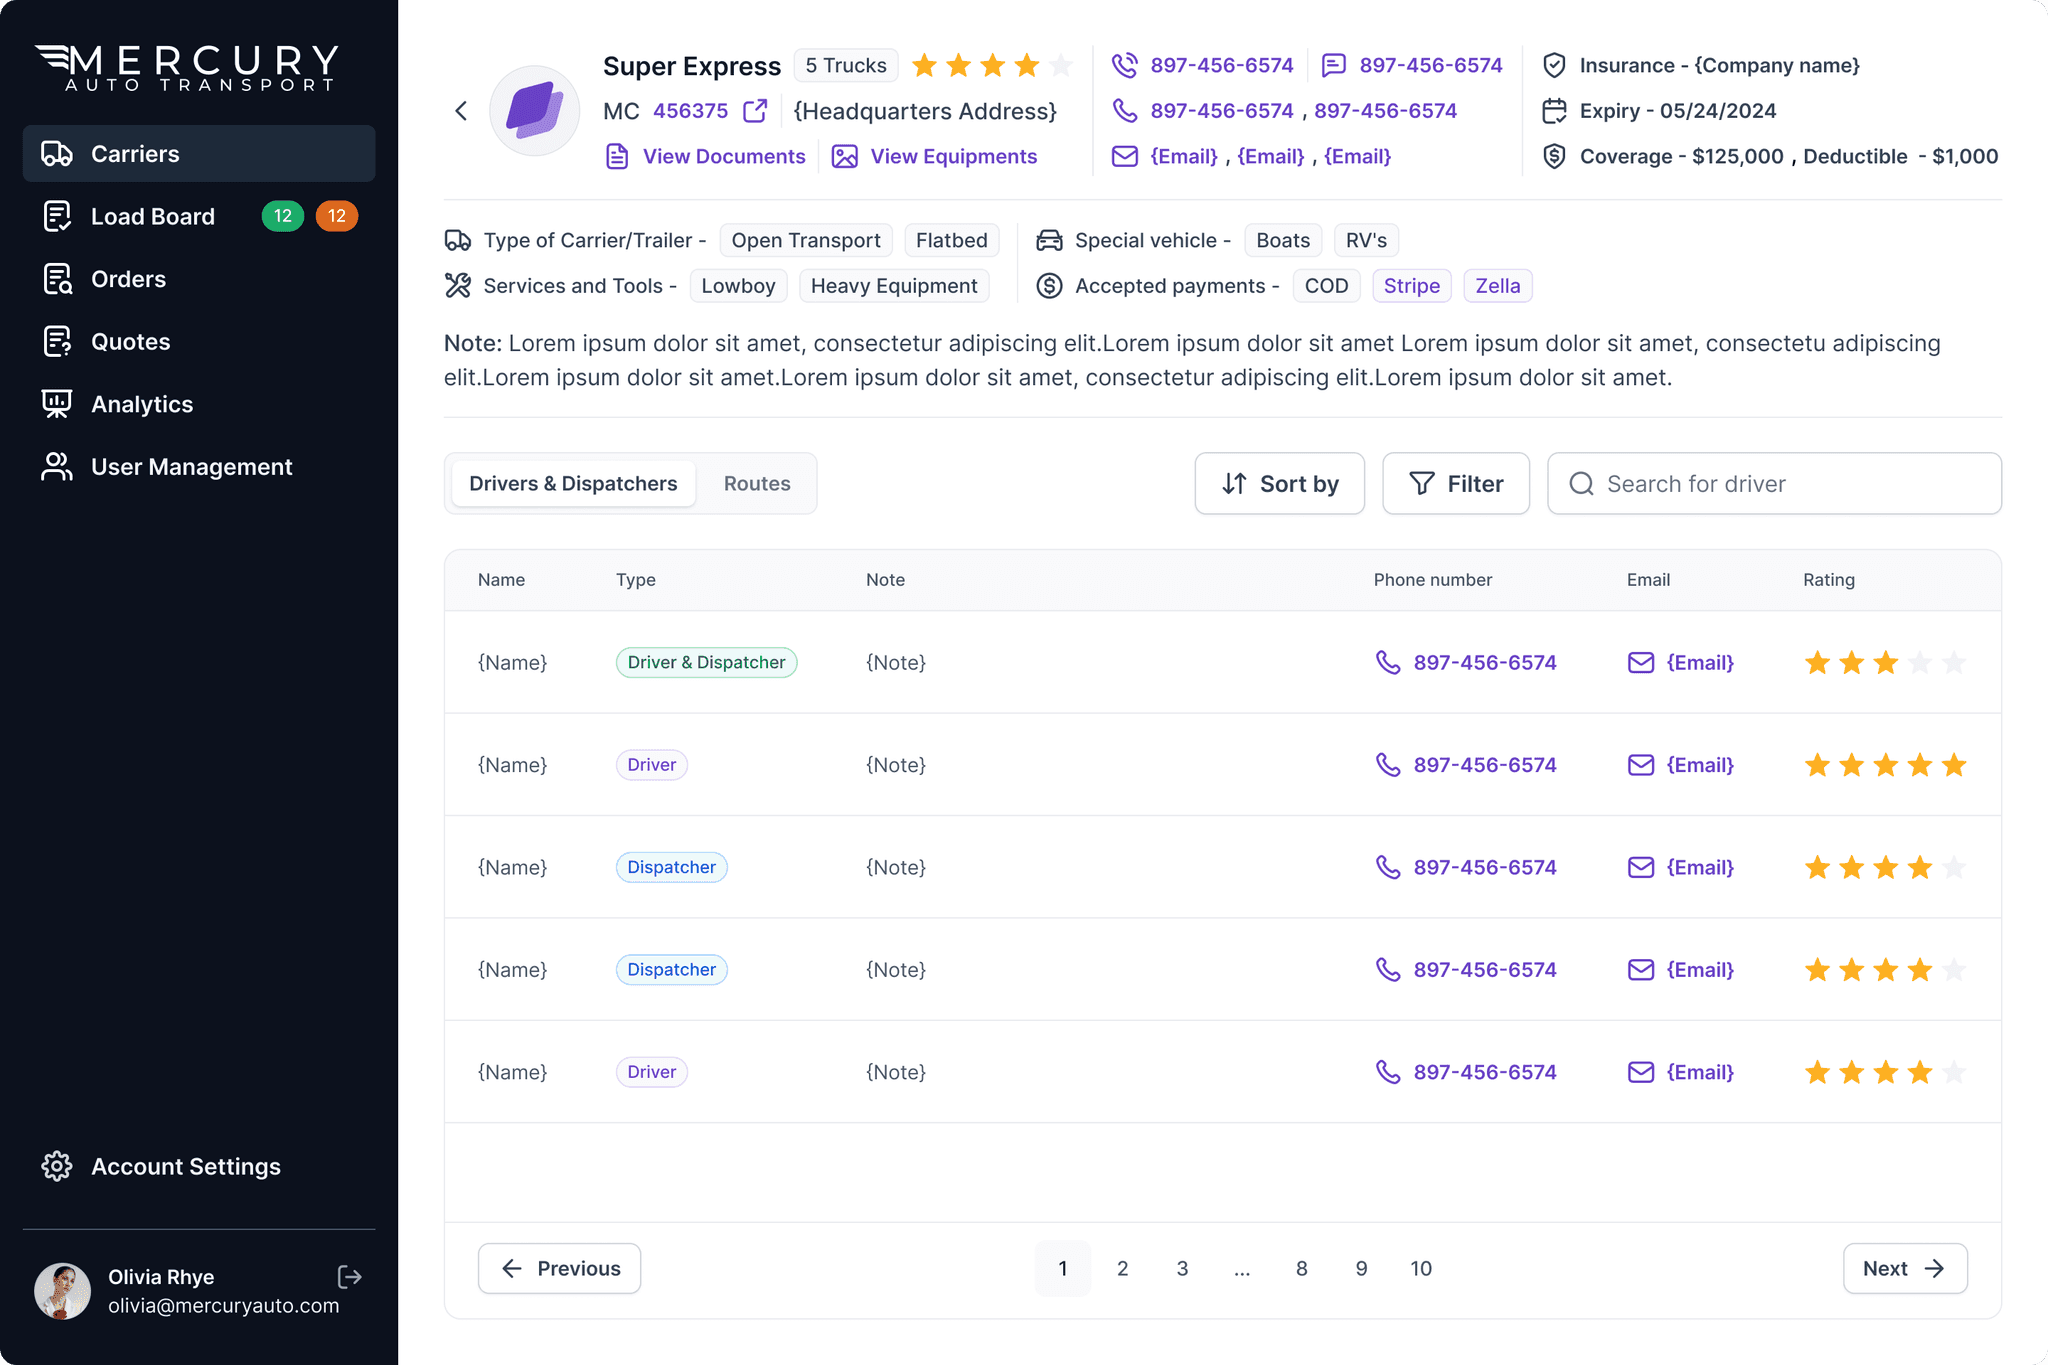
Admin Dashboard (Carrier)
This interface displays the specifics of the carrier, along with its list of Drivers and dispatchers. Plus, it reveals the Routes that the carrier is familiar with, making it convenient for the admin to gauge the carrier's professional prowess.
4
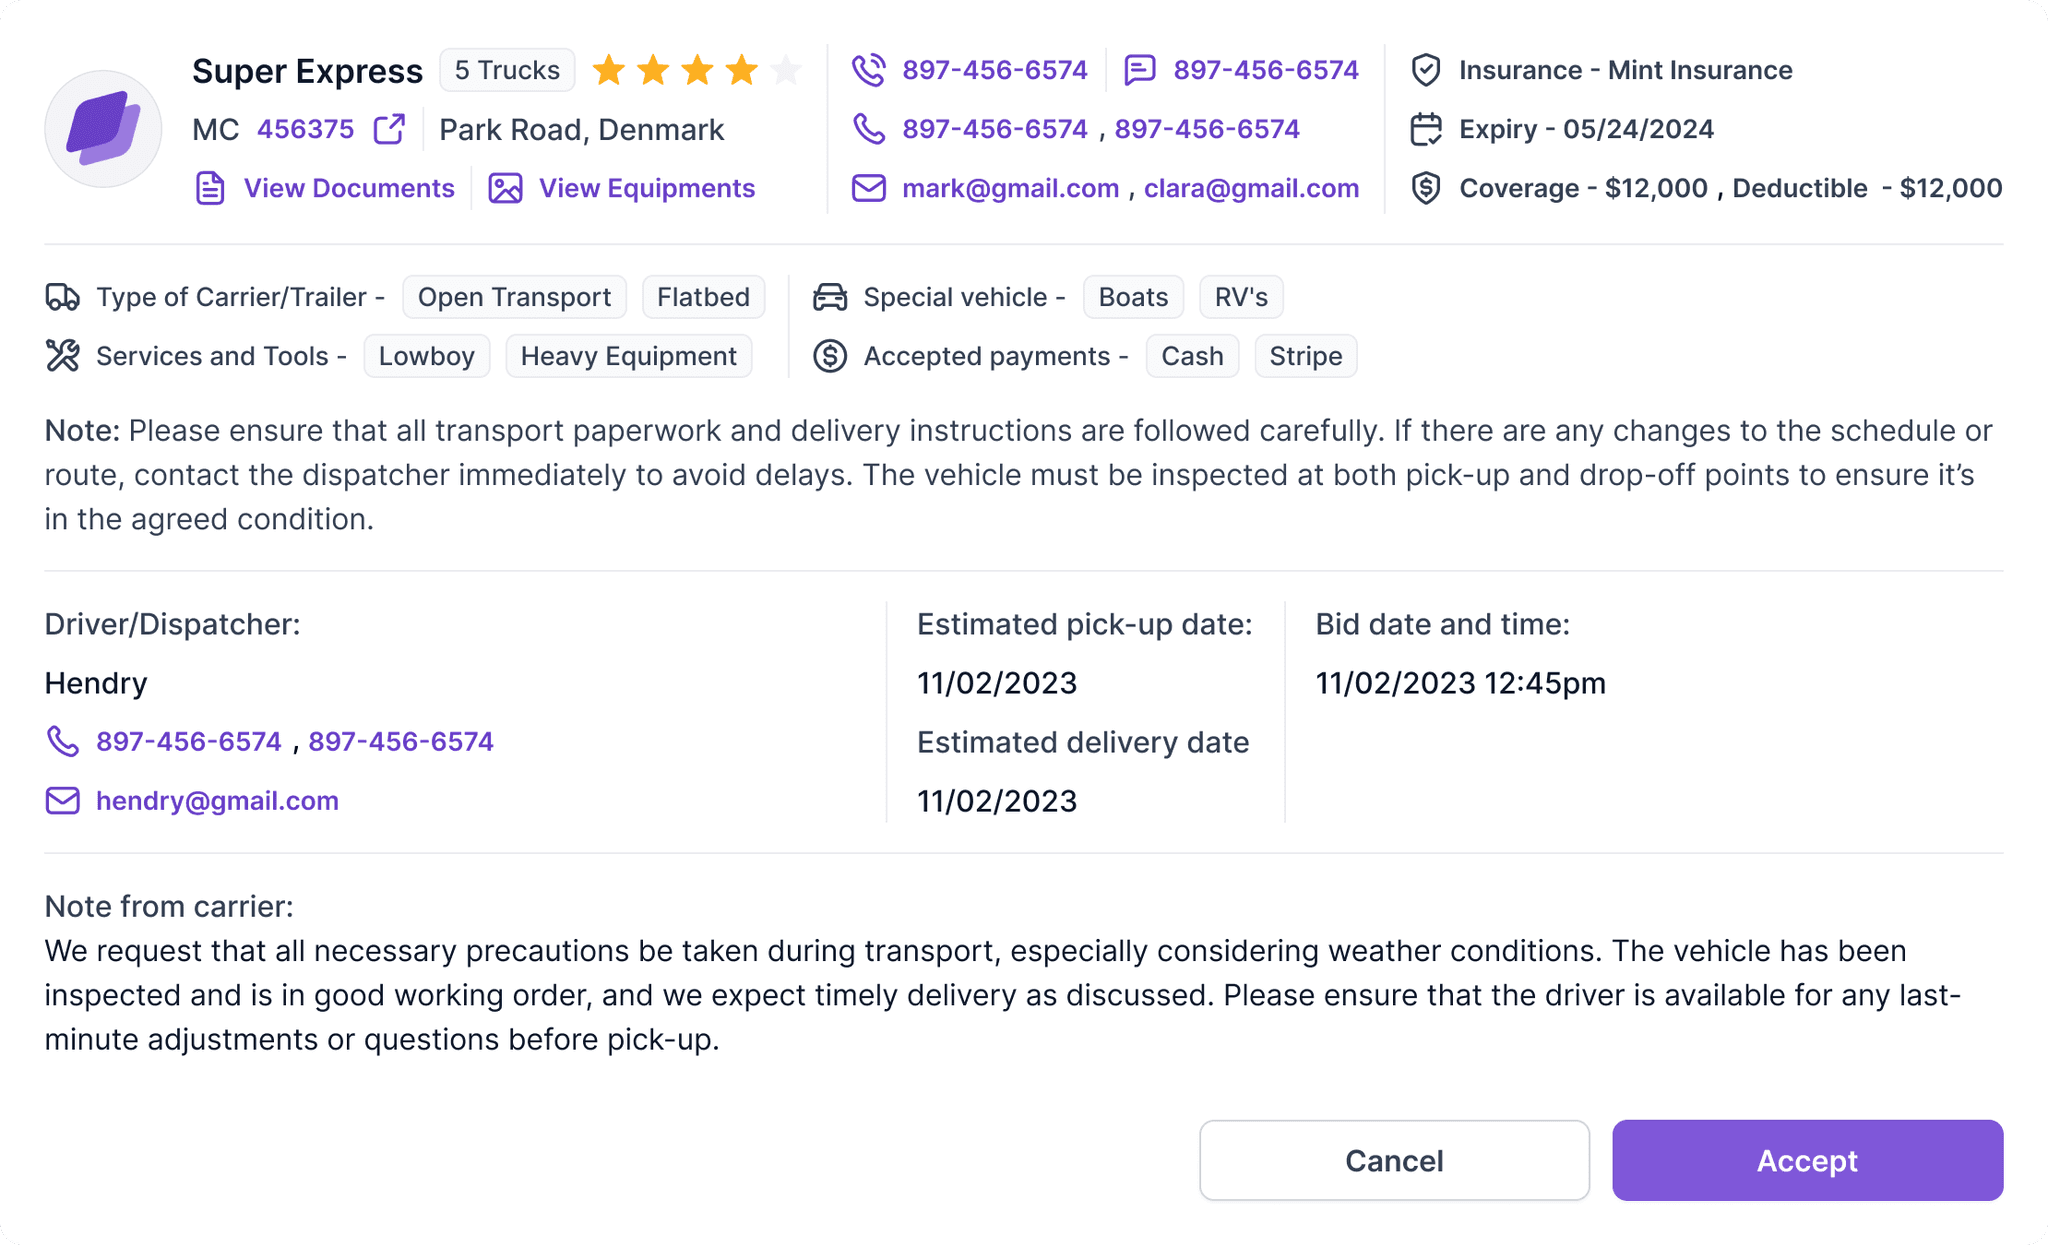
Carrier Info
This section provides comprehensive details about the carrier, including
Basic Information: Carrier name, MC number, address, phone numbers, and email address.
Insurance Details: Coverage information, including expiry date and coverage amount.
Carrier Type & Services: Trailer type, available services and tools, special vehicle information, and accepted payment methods.
Additional Notes: Any special notes about the carrier.
This section also includes key contact details such as
Driver Information: Driver’s name, phone number, and email.
Carrier Notes: Additional notes from the carrier, allowing the Mercury Auto team to review and accept the bid.
5
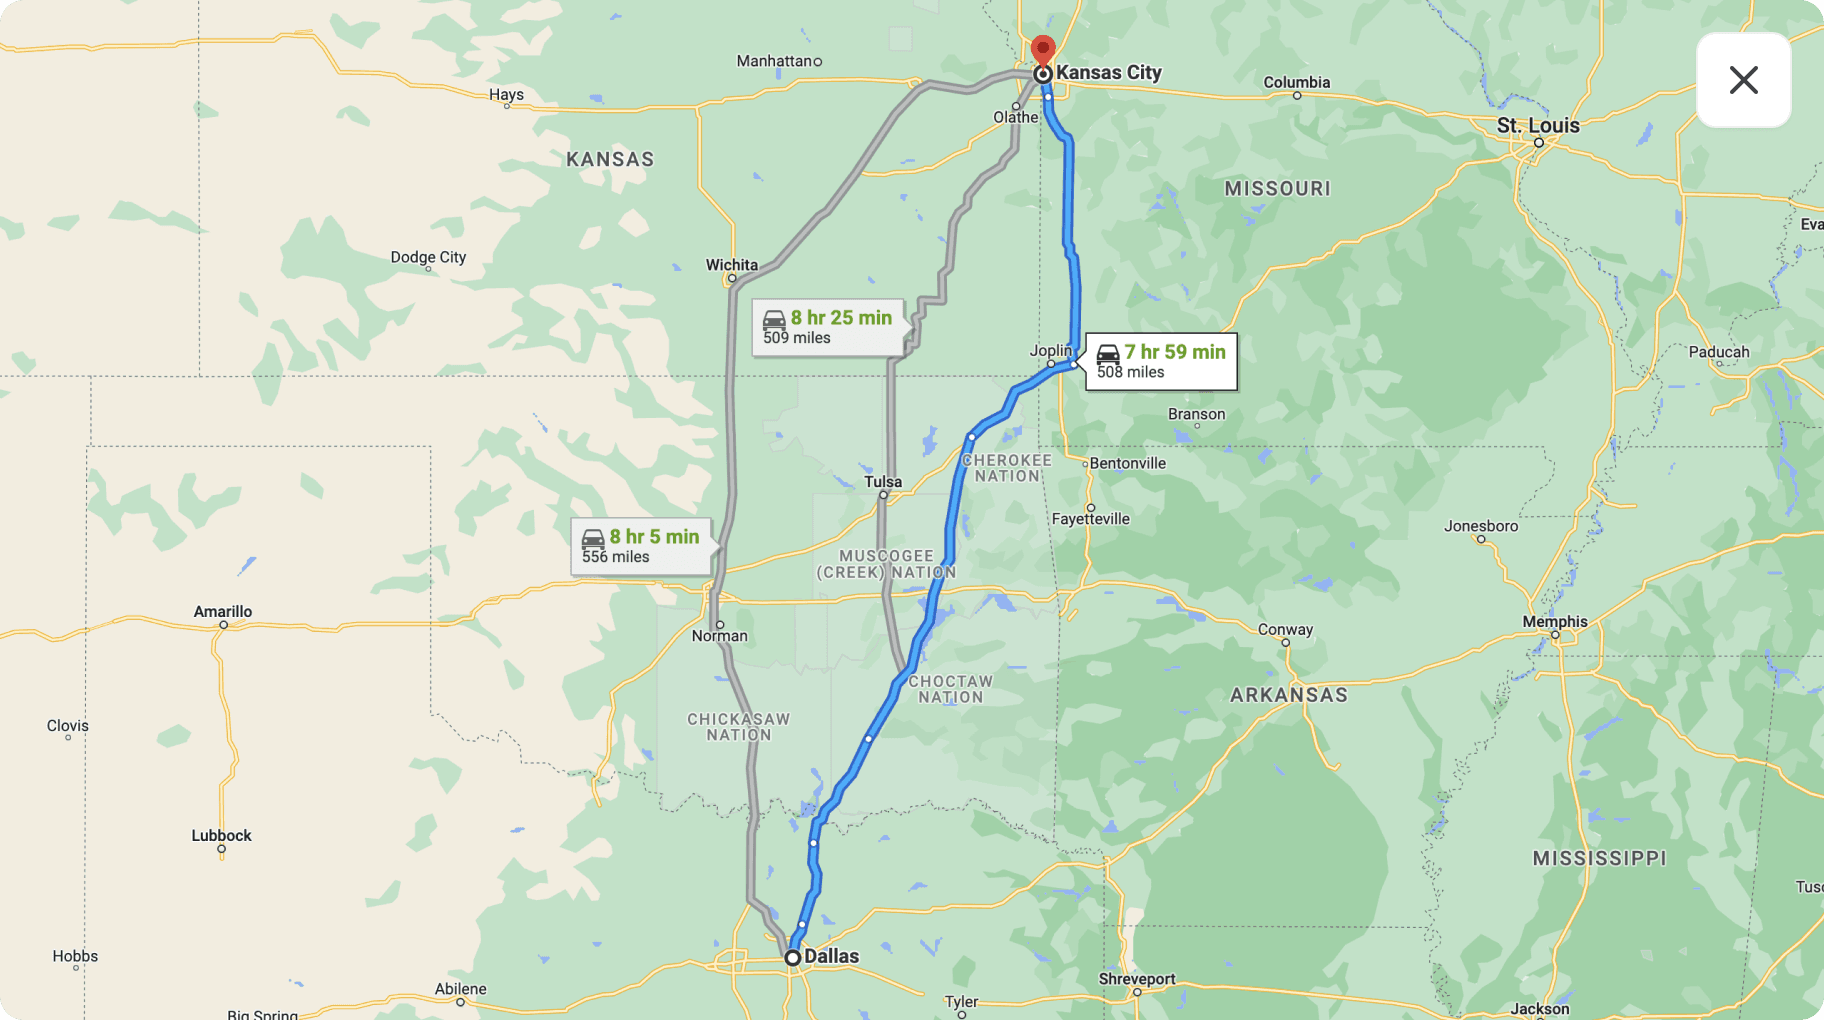
Map View
This pop-up displays the geographic visuals from the shipment's starting point to its final destination. Furthermore, it presents potential alternative paths the carrier might utilize.
6
Analytics
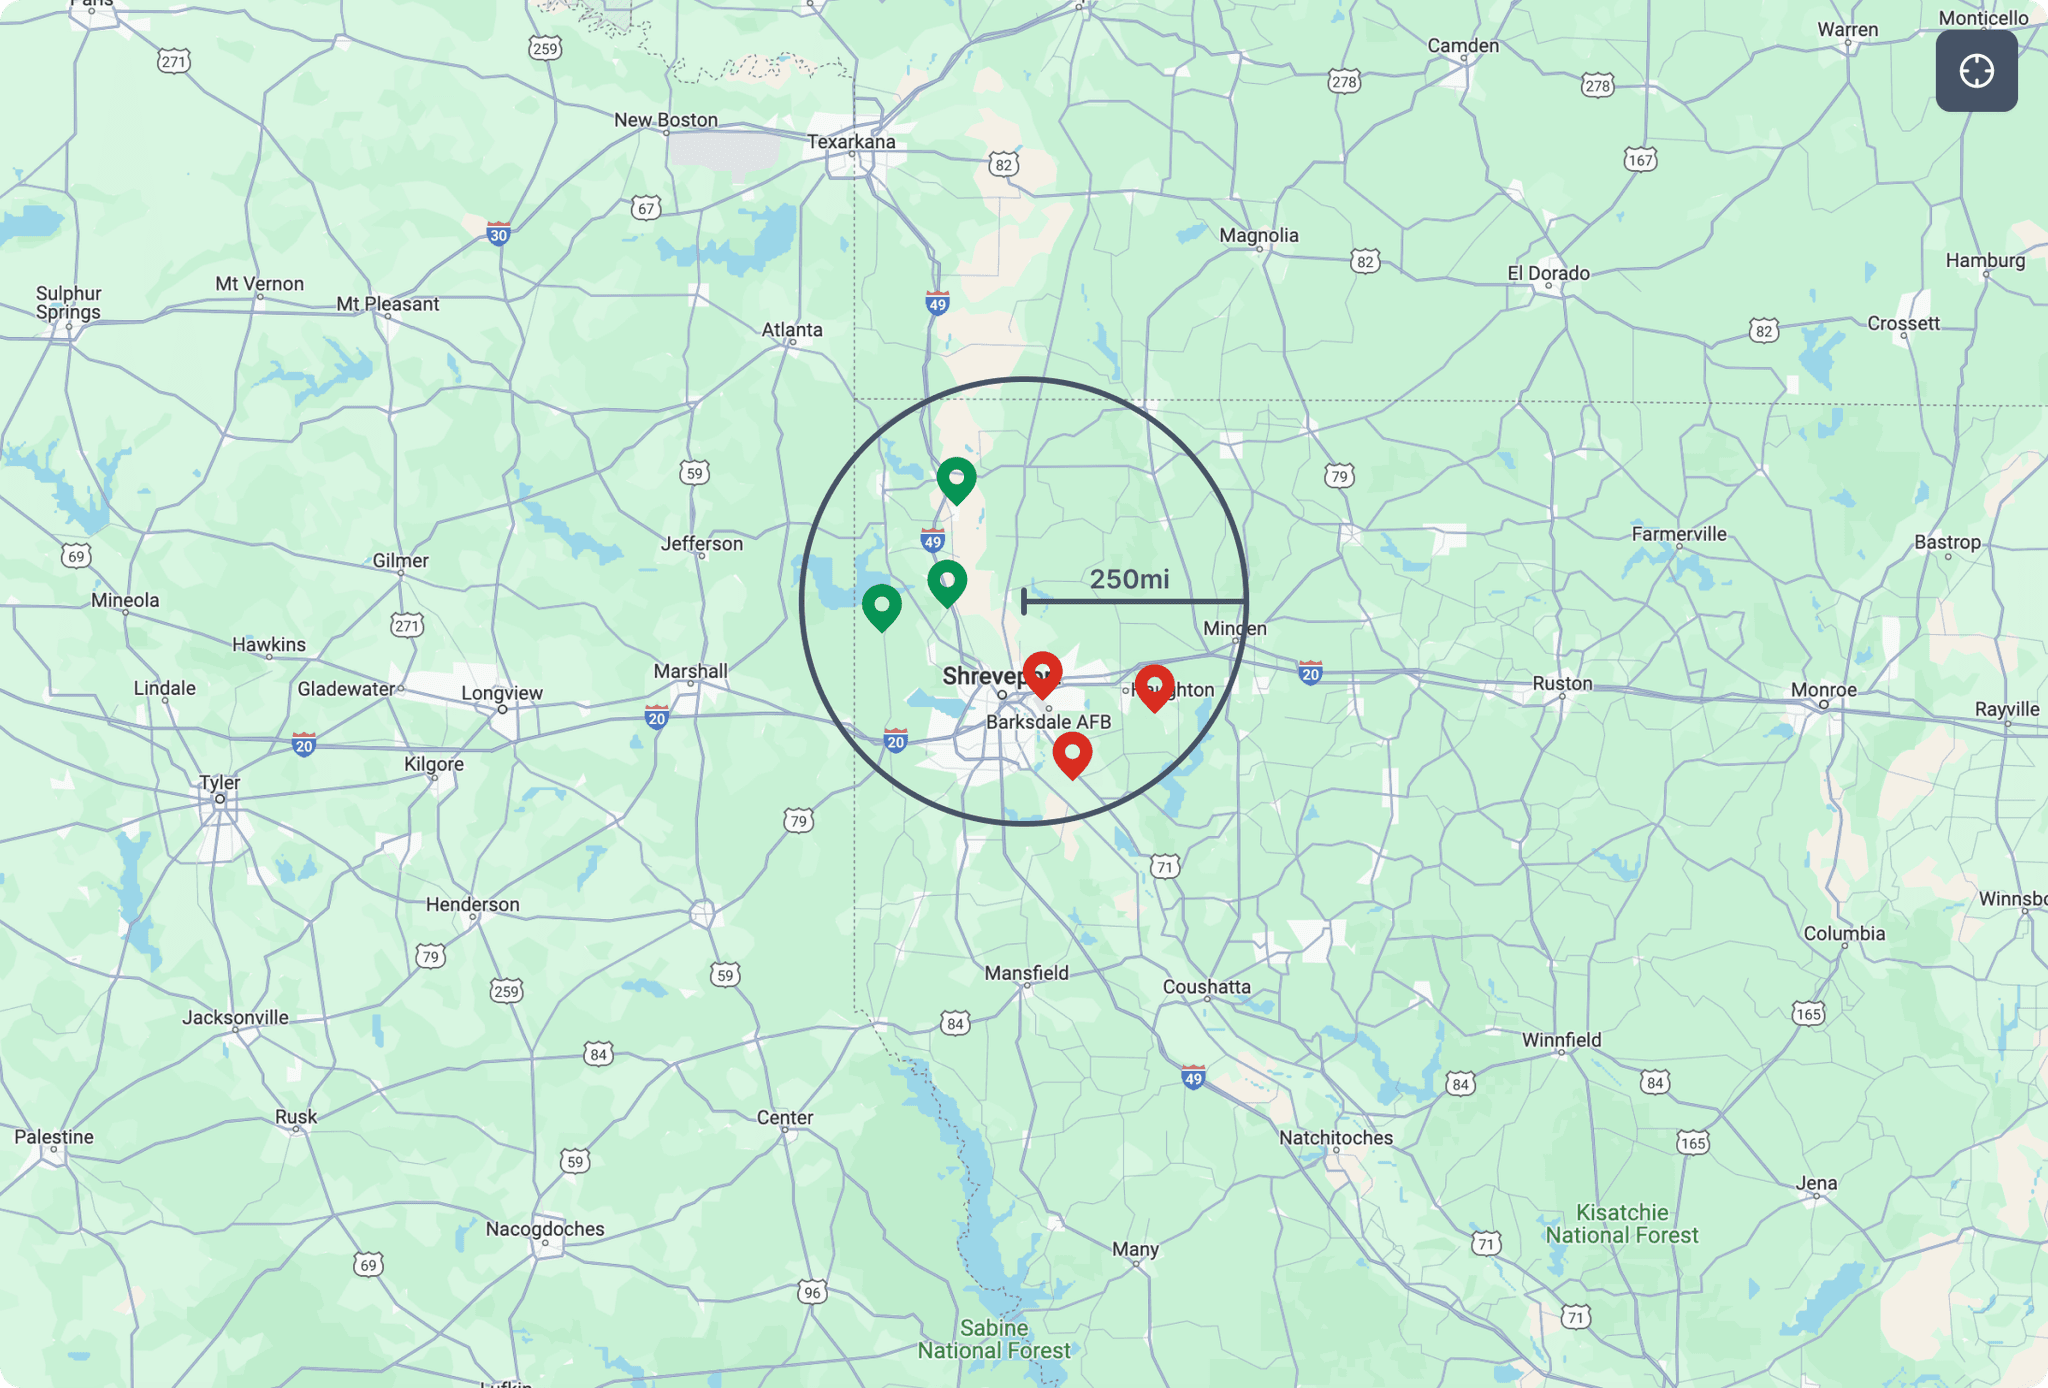
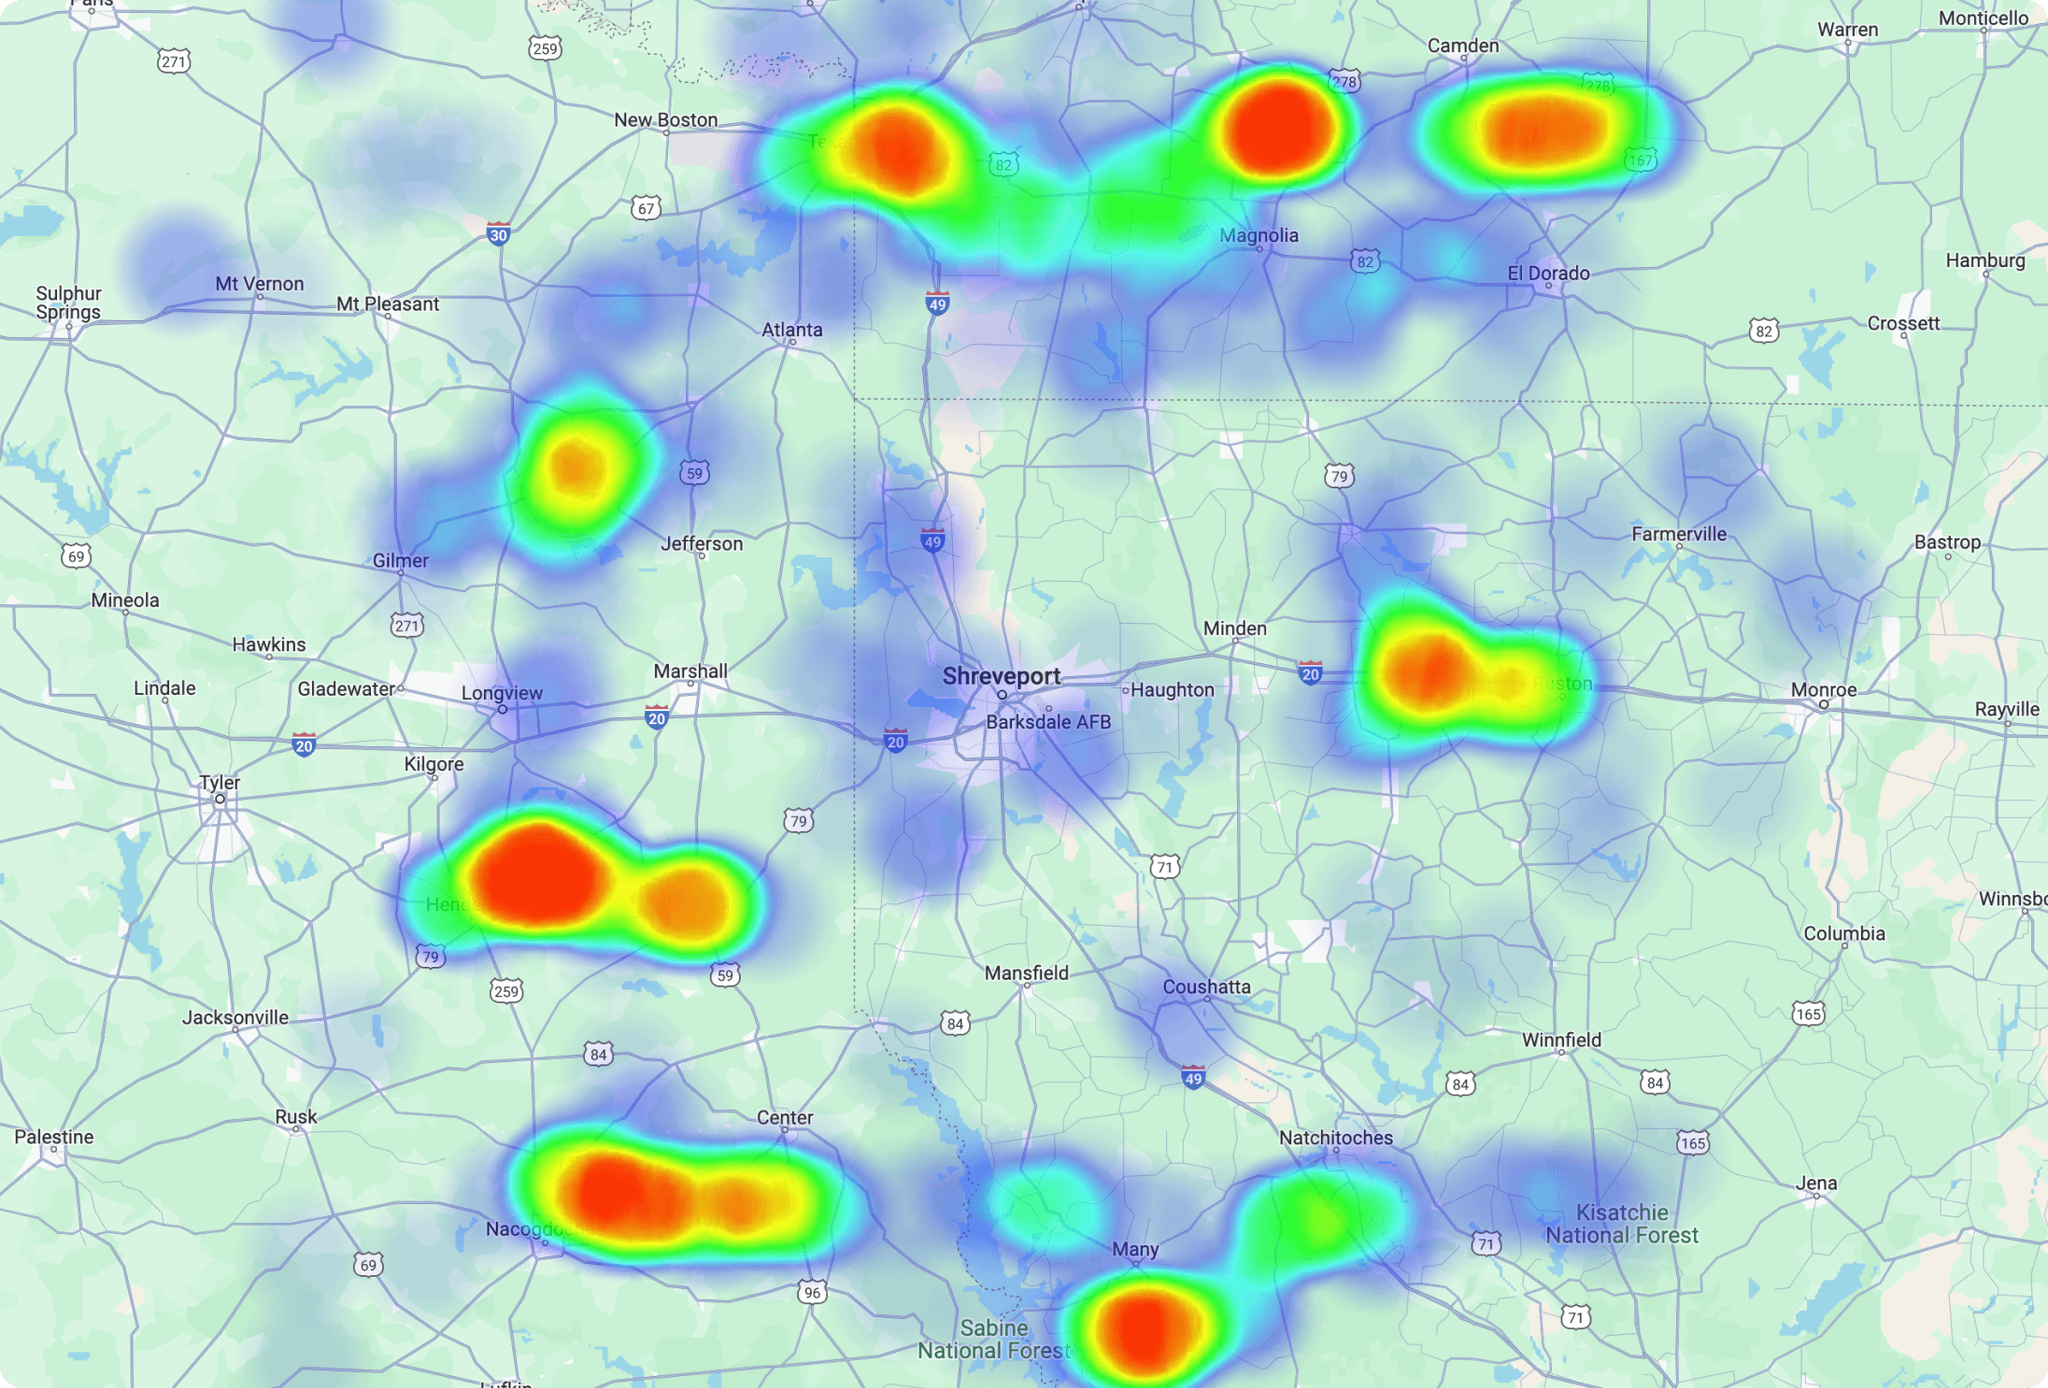
Analytics views: The Analytics menu gives 3 different options to view and filter the analytical data
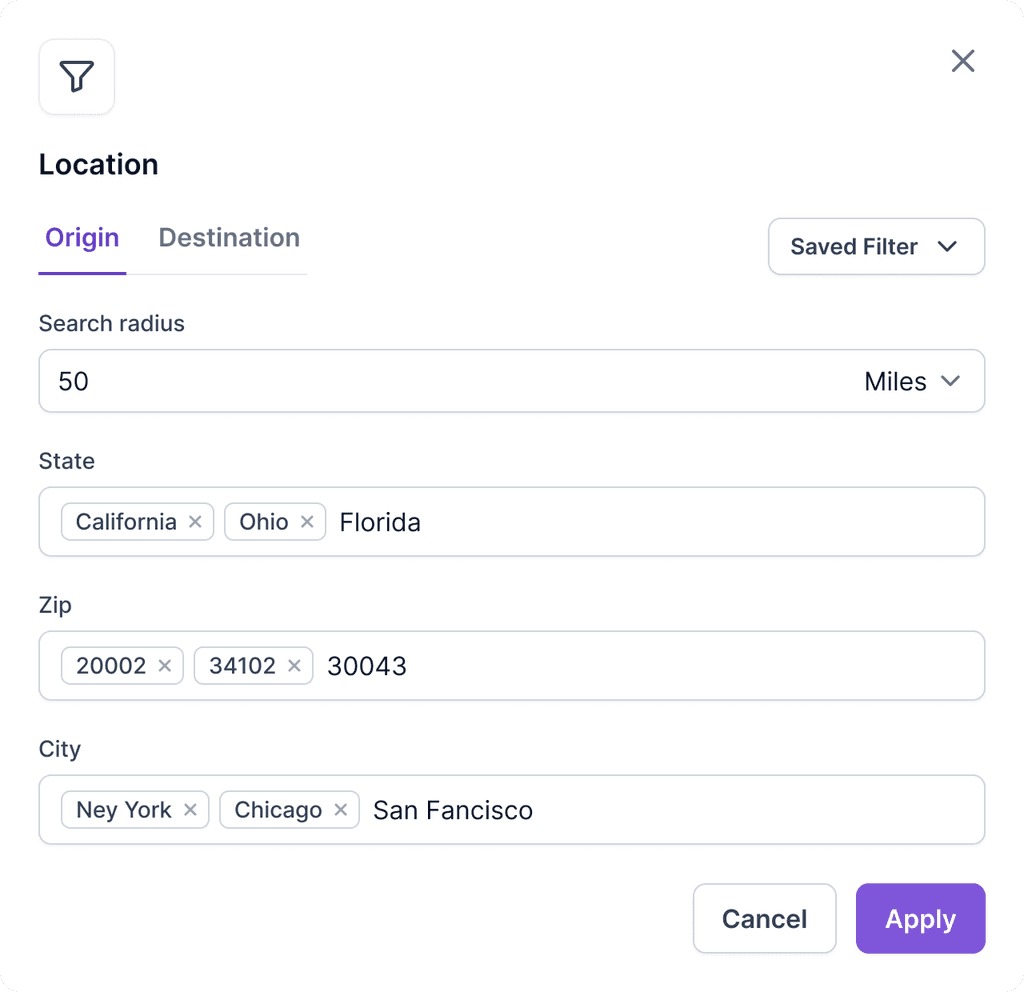
Pins: This view helps is showing the origin and the destination in a specific radius, for example it can show the data within 50mil radius.
Heat Map: The sorting option (e.g., by rate) allows users to customize how they view the sales data, potentially offering other sorting criteria to suit their analytical needs. This flexibility helps users focus on specific aspects of the data that are most relevant to their objectives, such as identifying high-performing months or understanding the impact of marketing campaigns.

